Telegram Group Analytics: What to Track and Why It Matters
Stop guessing about your Telegram group's health. Learn which metrics actually matter, how to track them, and how to turn data into decisions that grow your community.
Live directory
Browse Metricgram's curated Telegram directory to find active communities by category and language, and see how leading groups position their listings.
Open directoryMost Group Admins Are Flying Blind
Here's a question that separates good community managers from great ones: how many members in your Telegram group sent a message in the last 7 days?
Not how many members you have. Not how many messages were sent. How many unique people actually typed something and hit send.
If you don't know the answer — and most admins don't — you're making decisions based on gut feeling. You're guessing whether your community is healthy, guessing whether your content strategy works, guessing whether that experiment you tried last week made any difference.
Gut feeling works when your group has 30 people and you recognize every username. It completely breaks down when you hit hundreds or thousands of members. At that scale, you need data. Real data. Not Telegram's built-in "someone sent a message" counter.
Why Telegram's Built-in Stats Aren't Enough
Telegram does offer basic statistics for groups with 500+ members. You get member count, message count, and a few activity graphs. That's... fine. As a starting point.
But here's what Telegram doesn't tell you:
- What percentage of your members are actually active?
- Are you gaining active members or just adding dead weight?
- Which time of day gets the most engagement?
- Who are your top contributors and are they still active?
- Is engagement trending up or slowly bleeding out?
- How quickly do questions get answered?
These are the questions that drive real community strategy. Without answers, you're flying an airplane without instruments — you might be fine for a while, but eventually you're going to hit a mountain you didn't see coming.
Ready to improve your Telegram group? Start your 14-day Metricgram trial.
Start free trialThe Metrics That Actually Matter
Not all numbers deserve your attention. Some are vanity metrics that make you feel good but tell you nothing useful. Others are critical signals that should drive your decisions. Here's the difference.
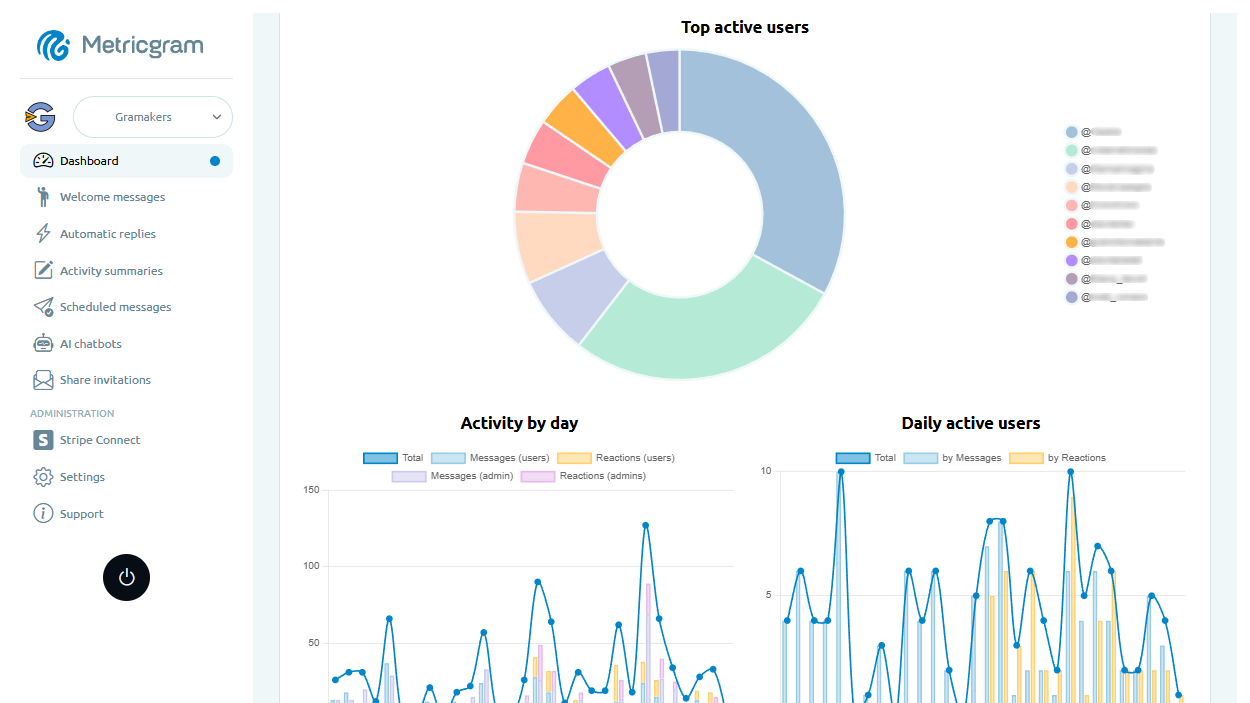
Daily Active Members (DAM) — Your North Star
This is the single most important metric for any Telegram group. It tells you how many unique members participated in the last 24 hours. Not read messages — actually sent something.
Why it matters: Total member count is a vanity metric. A group with 5,000 members and 50 daily actives has a 1% engagement rate. That looks impressive in a screenshot but it means 99% of your community is dead weight. Meanwhile, a group with 500 members and 100 daily actives is genuinely thriving at 20% engagement.
What to do with it: Track DAM over time. Plot it on a weekly basis. Are the numbers going up, down, or flat? A declining DAM is your earliest warning sign that something is wrong — and the earlier you catch it, the easier it is to fix.
Benchmark: For groups with 500+ members, 5-10% daily active rate is normal. Under 2% means the group is effectively dead. Over 15% is exceptional.
Message Volume and Distribution
Raw message count tells you about the overall noise level. But what matters more is the distribution — who's sending those messages?
200 messages from 3 people is a group chat, not a community. 200 messages from 50 people is a healthy discussion. Same number, completely different reality.
Track these specifically:
- Total messages per day
- Unique message senders per day
- Average messages per active member
- Peak activity hours (when are people most engaged?)
Why it matters: If your message-to-sender ratio is very high (say, 50 messages per person), you have a few power users carrying the entire group. That's fragile — if those 3 people get busy or lose interest, your group goes silent overnight.
What to do with it: If conversation is concentrated among a few people, you need to broaden participation. Gamification, discussion prompts, and direct engagement with quieter members all help distribute the conversation load.
Growth Rate (The Real One)
Adding 100 new members in a week feels great. But if 120 left during that same week, your group is actually shrinking. Net growth is what matters:
Net growth = New members - Departed members
A positive net growth means your group is getting bigger. A negative one means you're slowly dying. Zero means you're on a treadmill — running hard and going nowhere.
Why members leave:
- They didn't understand what the group was about (bad onboarding)
- The content wasn't relevant to them (wrong targeting)
- The group was too noisy (poor moderation)
- They never got a response when they asked something (no one engaged)
- They found a better alternative (competitive pressure)
What to do with it: If your churn is high, survey departing members if you can. Fix the root cause before spending energy on acquisition. Growing your member count while ignoring churn is like filling a bathtub with the drain open.
Engagement Rate
This is your most honest metric — the percentage of total members who are active within a given period.
Engagement rate = (Active members / Total members) × 100
Benchmarks for Telegram groups:
- < 2% — The group feels dead. Most people have mentally unsubscribed. Intervention needed.
- 2-5% — Normal for large groups (1,000+ members). There's activity but most members are passive.
- 5-15% — Healthy and active. Members are engaged and the community has momentum.
- > 15% — Exceptional. You're doing something right. Study what works and double down.
What to do with it: If engagement is below 5%, don't just post more content. Post different content. Ask questions instead of making statements. Run polls. Start challenges. Use gamification. The problem isn't visibility — it's that members don't have a compelling reason to participate.
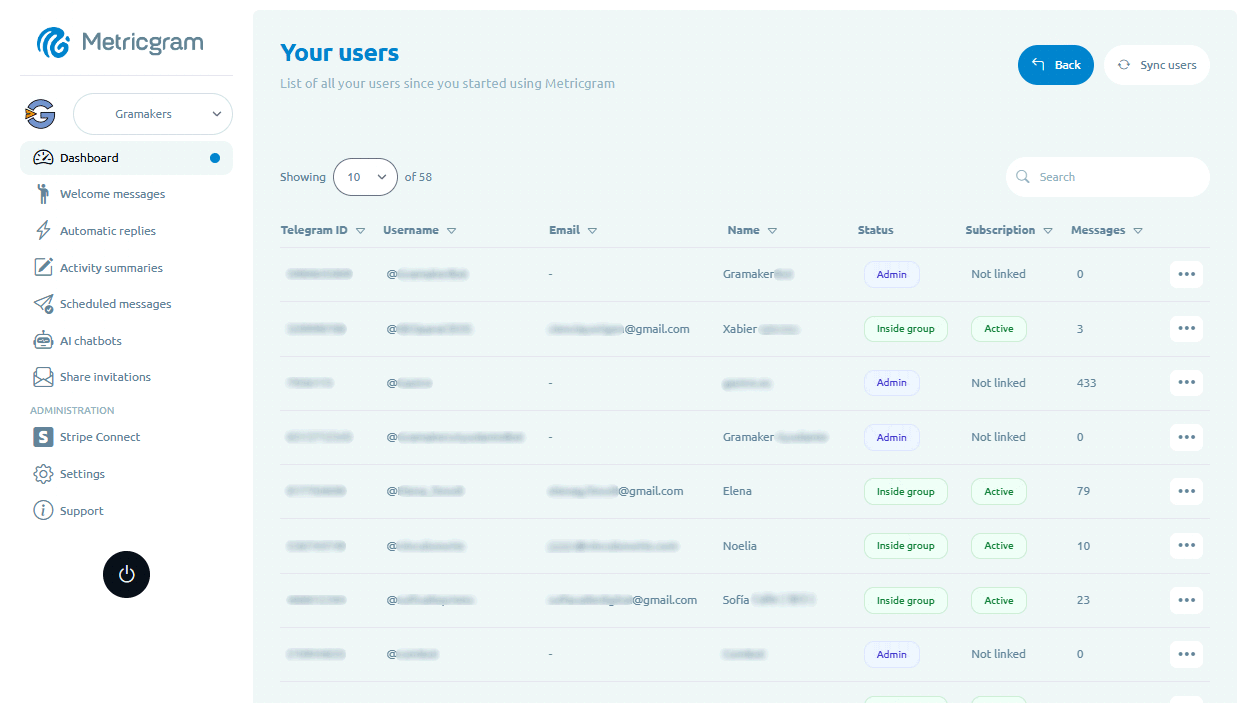
Top Contributors
Understanding who drives your community helps you in several ways:
- Recognize them — Public shoutouts, special roles, early access to features
- Protect them — If your top 3 contributors go silent, your group follows. Keep them engaged.
- Recruit them — Your most active members are your best candidates for moderators or ambassadors
- Learn from them — What topics do they post about? What time? What format? That's your content strategy, right there.
Response Time
How long does it take for a question to get answered in your group? This is crucial for support communities, paid groups, and any community where members expect help.
- Under 5 minutes: Exceptional. Members feel heard and valued.
- 5-30 minutes: Good. Most people are patient enough for this.
- 1-4 hours: Acceptable for non-urgent topics.
- Over 24 hours: Members will stop asking questions because they've learned nobody answers.
What to do with it: If response times are growing, consider auto-replies for common questions or an AI chatbot for basic support. You don't need to answer everything personally — you need to ensure everything gets answered.
How to Track These Metrics
Option 1: Manual Tracking (Please Don't)
You could theoretically count messages, track members in a spreadsheet, and calculate engagement rates by hand. Nobody does this more than once. It takes hours, it's error-prone, and by the time you finish, the data is already stale.
Option 2: Telegram's Built-in Statistics
Available for groups with 500+ members via the group info screen. Shows basic member counts and message graphs. It's free and built-in, but lacks the depth needed for real analysis. No engagement rates, no top contributor tracking, no response time metrics, no exportable reports.
Option 3: Purpose-Built Analytics
Tools like Metricgram connect to your group and track everything automatically. You get a real-time dashboard with historical trends, daily reports, and actionable metrics.
This is the only option that actually scales. You set it up once — literally connect your group and it starts tracking — and the data is always there when you need it. Weekly review takes 10 minutes.
Turning Data Into Action: A Simple Framework
Analytics are useless if they sit in a dashboard and you never look at them. Here's a framework that takes 15 minutes per week:
Every Monday morning:
- Open your dashboard — 1 minute
- Check DAM trend — Is it up, down, or flat vs. last week? (2 minutes)
- Review engagement rate — Any significant changes? (2 minutes)
- Check growth — Net new members. Any spikes or dips? (2 minutes)
- Scan top contributors — Anyone new climbing up? Anyone MIA? (2 minutes)
- Ask "why" — Pick the most interesting data point and investigate (5 minutes)
- Make one change — Based on what you found, tweak one thing this week (1 minute)
That's it. 15 minutes, every Monday. Over a month, you'll have made 4 data-informed adjustments to your strategy. Over a year, that's 52 improvements. The compound effect is enormous.
Example Scenarios
Scenario 1: DAM dropped 20% last week. You dig in and notice it coincided with you not posting anything for 3 days. Action: Set up scheduled messages so content posts even when you're busy.
Scenario 2: Engagement rate is 3% but one particular day last week it spiked to 8%. You check what happened — you ran a poll. Action: Run a poll every Tuesday and Thursday.
Scenario 3: Your top 3 contributors account for 60% of all messages. Action: Turn on gamification to incentivize broader participation. Directly message 5 quiet members and ask them a question.
Common Analytics Mistakes
- Obsessing over total members — It's a vanity metric. 10,000 members with 1% engagement is worse than 500 members with 20%.
- Checking stats daily — Weekly is the right cadence. Daily numbers fluctuate too much and you'll drive yourself crazy trying to explain random variation.
- Not comparing periods — "We had 150 messages today" means nothing without context. Compare to last week, last month. Look for trends, not snapshots.
- Ignoring declining trends — A slow 2% weekly decline in engagement doesn't feel urgent. But compound it over 3 months and you've lost 25% of your active base. Catch it early.
- Measuring everything — More metrics isn't better. Focus on 4-5 key numbers and ignore the rest. You can always dig deeper when something looks off.
- Not acting on data — The fanciest dashboard in the world is worthless if you look at the numbers and then change nothing. Every analytics session should end with one action item.
Start Tracking Today
If you take away one thing from this article: start measuring your engagement rate this week. It takes five minutes to set up and it changes how you think about your community forever.
Everything else — message distribution, growth analysis, contributor tracking — flows naturally from that first step. Once you see the real numbers, you can't go back to guessing.
Metricgram makes this effortless. Connect your group and you'll have a full analytics dashboard in minutes. Free trial, no credit card, no setup hassle.
Your community's health isn't a mystery. It's a metric. Start measuring it.
Ready to manage your Telegram group with Metricgram?
Automate tasks, track analytics, and grow your community with a 14-day free trial. No credit card required.
Start free trialGet weekly Telegram community tips
Join community managers who receive our best tips, guides, and product updates.
You may also like
Best Mighty Networks Alternative For Paid Communities That Need Faster Daily Engagement
Looking for a Mighty Networks alternative? This guide explains where Mighty Networks is strong, where it can be too heavy, and why Telegram plus Metricgram can be better for fast-moving paid communities.
Paid Community Platforms Compared: Telegram, Circle, Discord, Skool And The Tradeoffs That Matter
Choosing a paid community platform is not about aesthetics. This guide compares Telegram, Circle, Discord, and Skool through the lens of community operations, monetization, onboarding, and ownership so you can pick the right stack.